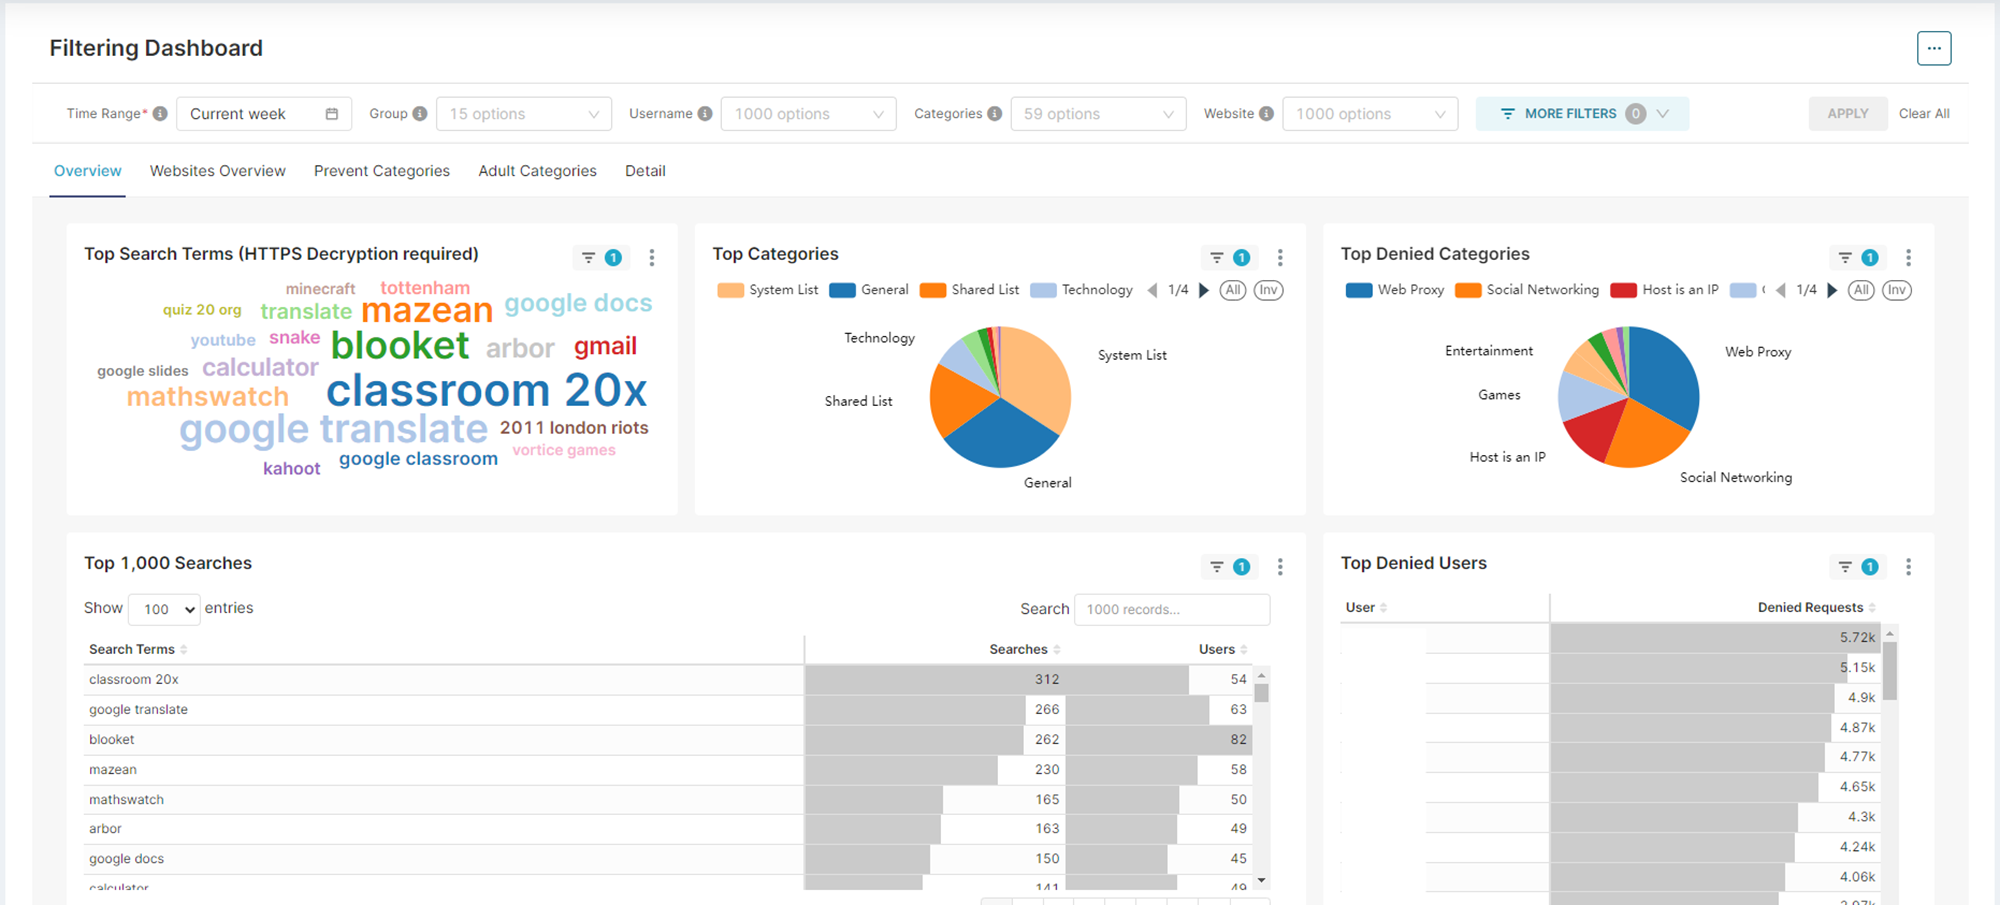
SchoolProtect now includes a real-time dashboard as a new way to interact with your schools' filtering data.
Please note: This functionality is still in BETA and we are rolling it out to schools slowly.
Most of the data in the dashboard requires both user authentication and HTTPS decryption to be set up. Please check this first if some of the charts are empty.
To access the dashboard, log into SchoolProtect then navigate to Reports > Dashboard:

Filtering the Data
At the top of each page is the filter bar which allows you to change the time-range or apply filters to your dashboard.

After selecting a filter, you must click the APPLY button on the right-hand side for the change to take effect:

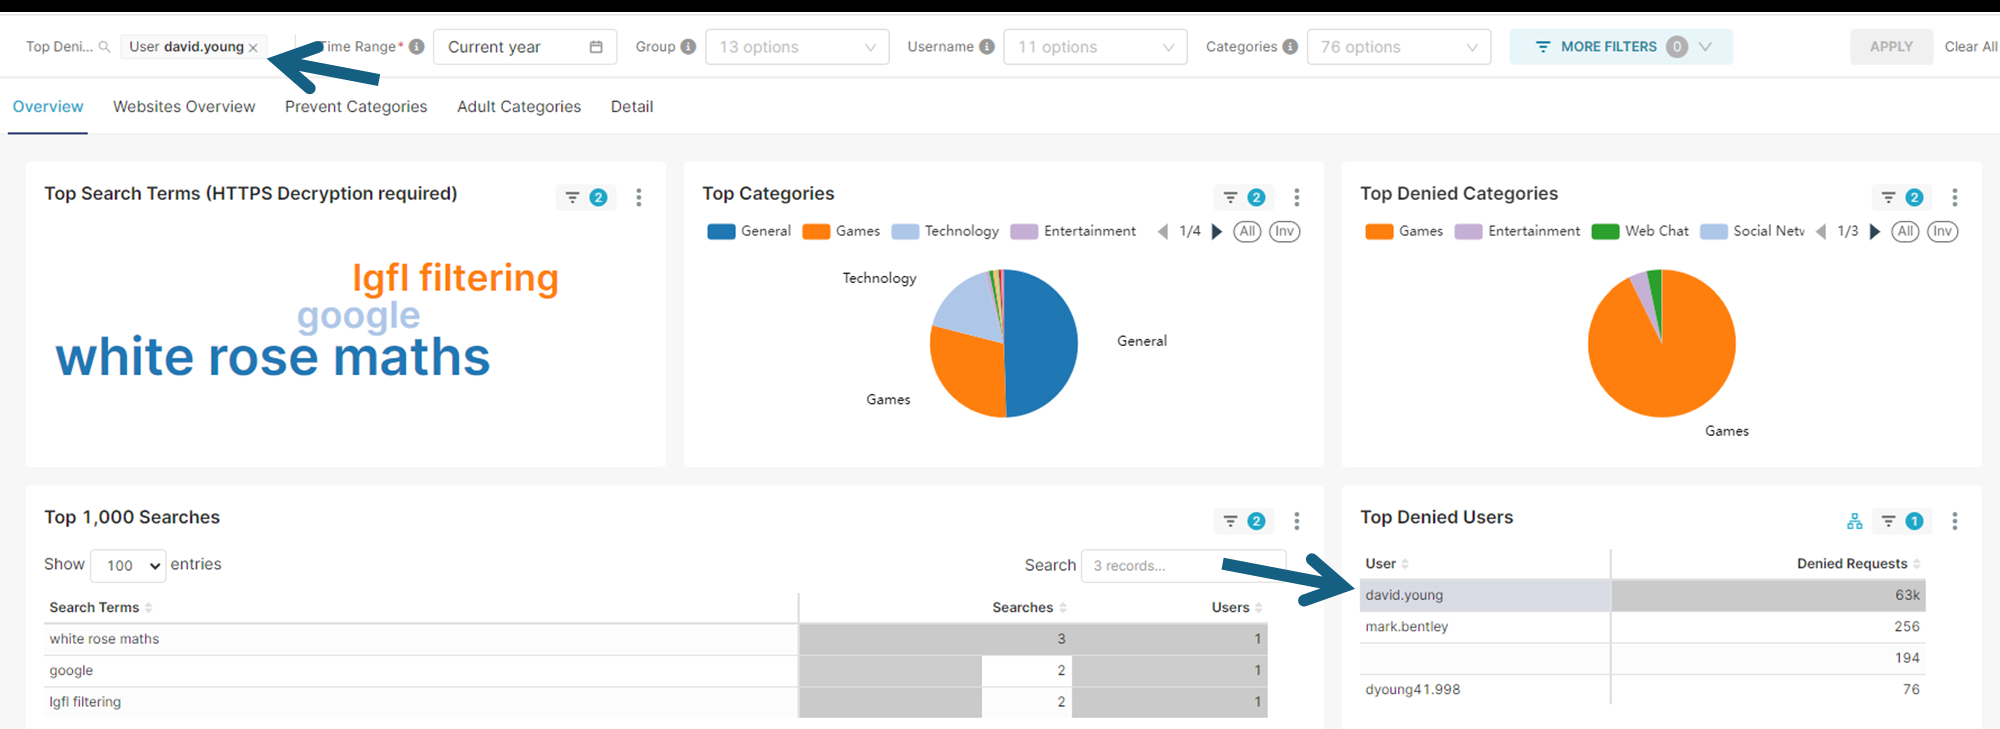
You can also filter directly from charts in the dashboard, e.g. by clicking a segment on a pie-chart or item in a list. For example, you can click a username in the list of 'Top Denied Users' or 'Requests by User' tables to limit your view to a single user.

Filters persist across tabs so you can select the user or policy from the overview and drill down into details on other tabs.
Tabs
The dashboard has 5 tabs:
1.Overview - Shows an overview of the filtering with search-terms, categories and policy/user lists
2.Websites Overview - Shows the top allowed and blocked websites
3.Prevent Categories - Website overview and detail list that is pre-filtered by the Prevent categories (Criminal Skills, Hate Speech, Weapons and Extreme)
4.Adult Categories - Website overview and detail list that is pre-filtered by adult-related categories
5.Detail - A full list of all URLs visited based on the current filters (useful for exporting to Excel, etc.)
Exporting Data
Data can be exported either as an image of the whole dashboard page or on a per-chart basis (image or Excel/CSV).
To save an export of the entire dashboard click on the … in the top-right then Download and choose PDF or Image to download:

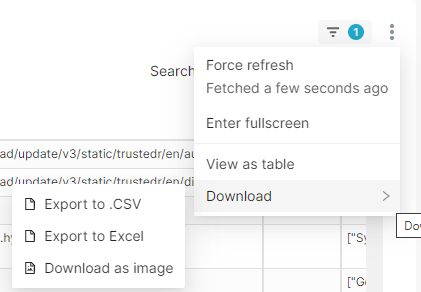
To export data from specific charts, click the horizontal  in the top-right of the chart then Download and choose Export to CSV or Excel or Download as image. Exporting to CSV or Excel will give the raw data and is best for tables.

Need more help?
If you have any questions or need further assistance, please visit our FAQ page for answers to the most common queries. Our support team is also available for any additional support you may need.
Also See: